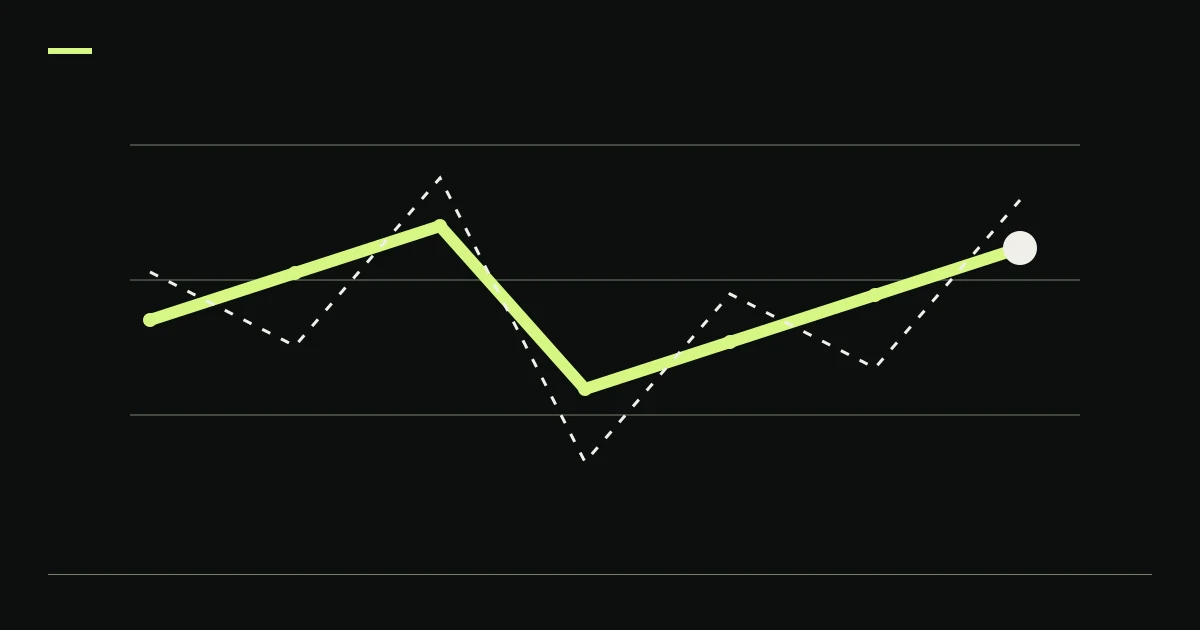
Crypto maximum drawdown is the largest decline from a prior equity peak to a later trough within the measured sample. Compute it from a defined marked portfolio series, including open positions and costs, and keep external cash flows separate. Recovery is a different measurement: a 20% loss needs a 25% gain on the reduced equity to regain the old peak, with no guarantee that recovery will occur.
A report can finish profitable while concealing a large interim loss. The practical question is not only where the equity line ended, but what account value, exposure and recovery time occurred along the way.
Calculate the peak before calculating the fall
For each observation, define the running peak as the highest equity recorded up to that observation. Express drawdown as 1 − current equity / running peak. This article uses positive percentages for loss depth. Some reports show negative percentages instead; check the convention before comparing numbers.
Here is an original hypothetical seven-day equity series. Assume one observation at the same UTC time each day, no deposits or withdrawals, all open positions marked consistently and all included trading costs already deducted. These are invented values, not a KLINEO backtest.
| Observation | Marked equity | Running peak | Drawdown depth |
|---|---|---|---|
| Day 0 | $1,000 | $1,000 | 0% |
| Day 1 | $1,100 | $1,100 | 0% |
| Day 2 | $880 | $1,100 | 20% |
| Day 3 | $990 | $1,100 | 10% |
| Day 4 | $1,100 | $1,100 | 0% |
| Day 5 | $1,050 | $1,100 | 4.55%, rounded |
| Day 6 | $1,150 | $1,150 | 0% |
The sample's maximum observed drawdown is 1 − 880 / 1,100 = 20%. Its final return is 1,150 / 1,000 − 1 = 15%. Both statements are true. Reporting only the final return removes the loss path that occurred before it.
Attach the peak and trough timestamps to the percentage. They let another reader locate the episode and inspect what the portfolio held. If a later observation creates a new peak, earlier historical drawdown does not disappear.
Recovery has a different denominator
After a fractional loss d, remaining equity is starting equity × (1 − d). Recovering the original amount requires a fractional gain of d / (1 − d) on that reduced equity. This is algebra with fixed endpoints, not a prediction about how quickly a market or strategy will recover.
| Loss from peak | Equity remaining from a hypothetical $1,000 | Gain needed to regain $1,000 |
|---|---|---|
| 10% | $900 | 11.11%, rounded |
| 20% | $800 | 25% |
| 40% | $600 | 66.67%, rounded |
| 60% | $400 | 150% |
For the first dataset, recovery from $880 to $1,100 requires $220 / $880 = 25%. The original decline was $220 / $1,100 = 20%. The dollar amount matches, while the base changes.
CME's risk education illustrates the same loss-and-recovery asymmetry. Its examples concern futures risk; the arithmetic does not establish an appropriate loss allowance for a crypto account or guarantee that a stop limits loss to a planned amount. CME on recovering trading losses
At a complete loss, this recovery expression has a zero denominator. “Gain 100% after losing 100%” is not a recovery plan for the wiped-out capital. New capital would be an external contribution and must be identified separately.
Define the clock for time underwater
Drawdown depth does not describe its duration. In the seven-day example, the earlier peak is Day 1, the trough is Day 2 and the first observation regaining that peak is Day 4. Peak-to-recovery elapsed time is three days under the stated daily sampling schedule. The portfolio is observed below its old peak on Day 2 and Day 3.
A report might instead count periods from the first below-peak observation, include the recovery observation or measure trading hours rather than calendar days. These conventions produce different duration labels. State the peak, trough and recovery timestamps so the reader does not have to infer the counting method.
If the sample ends before recovery, mark the episode as unrecovered at the endpoint. Do not drop it from average recovery-time statistics simply because its final duration is unknown. Doing so can favor short completed episodes while omitting the most persistent loss period.
For a strategy that stops operating after a drawdown, a later market rebound is not automatically a strategy recovery. The model must still specify what positions were held and which rules remained active. A price chart cannot fill in a missing portfolio continuation.
Sampling can hide the worst point
A maximum drawdown computed from daily closes is the maximum visible at those observations. Intraday equity may have fallen further. Sampling only monthly endpoints can conceal losses that reverse before month end, while closed-trade accounting can miss unrealized losses entirely.
CME's discussion of evaluating trading advisors explicitly distinguishes drawdown depth, duration and recovery, and notes that a monthly report may omit larger losses within the month. That supports inspecting sampling frequency rather than treating all drawdown labels as comparable. CME on drawdown measurement
The valuation basis also matters. Last-trade prices, midprices, executable-side prices and liquidation marks can yield different series. A thin market may have a stale last trade. A bid-side mark might be more cautious for a long position but still does not prove the full quantity could sell there.
Record how stale marks, unavailable prices and market interruptions are handled. Removing uncomfortable observations makes the series cleaner while potentially understating the uncertainty. The survivorship-bias guide develops the related problem of positions whose instruments disappear from a modern asset list.
Closed profit is not marked equity
Consider another invented spot account. It begins an interval with $5,000 cash and an asset position worth $5,000. Its equity is $10,000. The position then falls to $3,500 while cash remains $5,000. Equity becomes $8,500, a 15% decline, even though the account has not closed a losing trade.
A dashboard that reports only realized P&L can show zero for the interval. That is not an arithmetic contradiction; it is a different accounting quantity. The portfolio carries an unrealized loss that matters to current equity and available exposure.
The expectancy and win-rate worksheet explains why completed-trade statistics need an explicit grouping rule. Pair them with marked equity when reviewing a strategy that can hold losses open or add to a declining position.
For margin or derivatives accounts, liabilities, collateral valuation, funding and liquidation rules add further requirements. A spot cash-plus-holdings example does not establish how those accounts should be marked. Read the venue and product-specific definitions instead of relabeling one series for every market.
A deposit is not performance recovery
External cash can make a balance chart look recovered without undoing a loss. Suppose an invented account starts with $10,000, loses $2,000 and then receives a $2,000 deposit. Its balance returns to $10,000. Its investment performance has not regained the original value of the previously invested capital.
One way to expose the distinction is unit accounting under a simplified no-fee contribution convention. Start with 1,000 units at $10 each. After the loss, unit value is $8. Issue 250 new units for the $2,000 deposit at that value. The account now holds $10,000 across 1,250 units, still $8 per unit. The contribution did not create a trading gain.
This constructed example assumes contribution valuation is available and unambiguous. Real reporting needs an explicit cash-flow timing method, especially when flows occur within a return interval. A raw account balance and a performance-adjusted series can both be useful, but must be labeled and kept distinct.
Read drawdown with the other evidence
Maximum drawdown is a path statistic from the observed sample. It is not a future worst-case loss cap, and it contains no probability that a deeper decline will occur. Longer or different samples can reveal different episodes even when the strategy settings stay fixed.
Use Monte Carlo trade-sequence exercises to inspect the consequences of a declared resampling model, while keeping its missing regimes and dependencies explicit. Reordering familiar trades cannot establish that the future contains no larger loss.
Likewise, a favorable Sharpe or Sortino ratio does not replace the actual drawdown path. Request all three only with compatible return definitions, costs and sampling intervals. For KLINEO's historical evidence, read the distinction between published drawdown measures in the backtest methodology.
Method and limits
This AI-assisted article uses linked primary education material and original hypothetical equity, position and contribution examples. Running peaks, percentage losses, recovery gains and unit accounting were independently recomputed. No historical KLINEO portfolio, customer balance or liquidation scenario was analyzed. These worksheets clarify reporting and do not establish a suitable risk level or remove the risks of trading.